Using the Profiler Panel
The profiler panel shows all your profiled methods in one place. Here’s how to use it effectively.
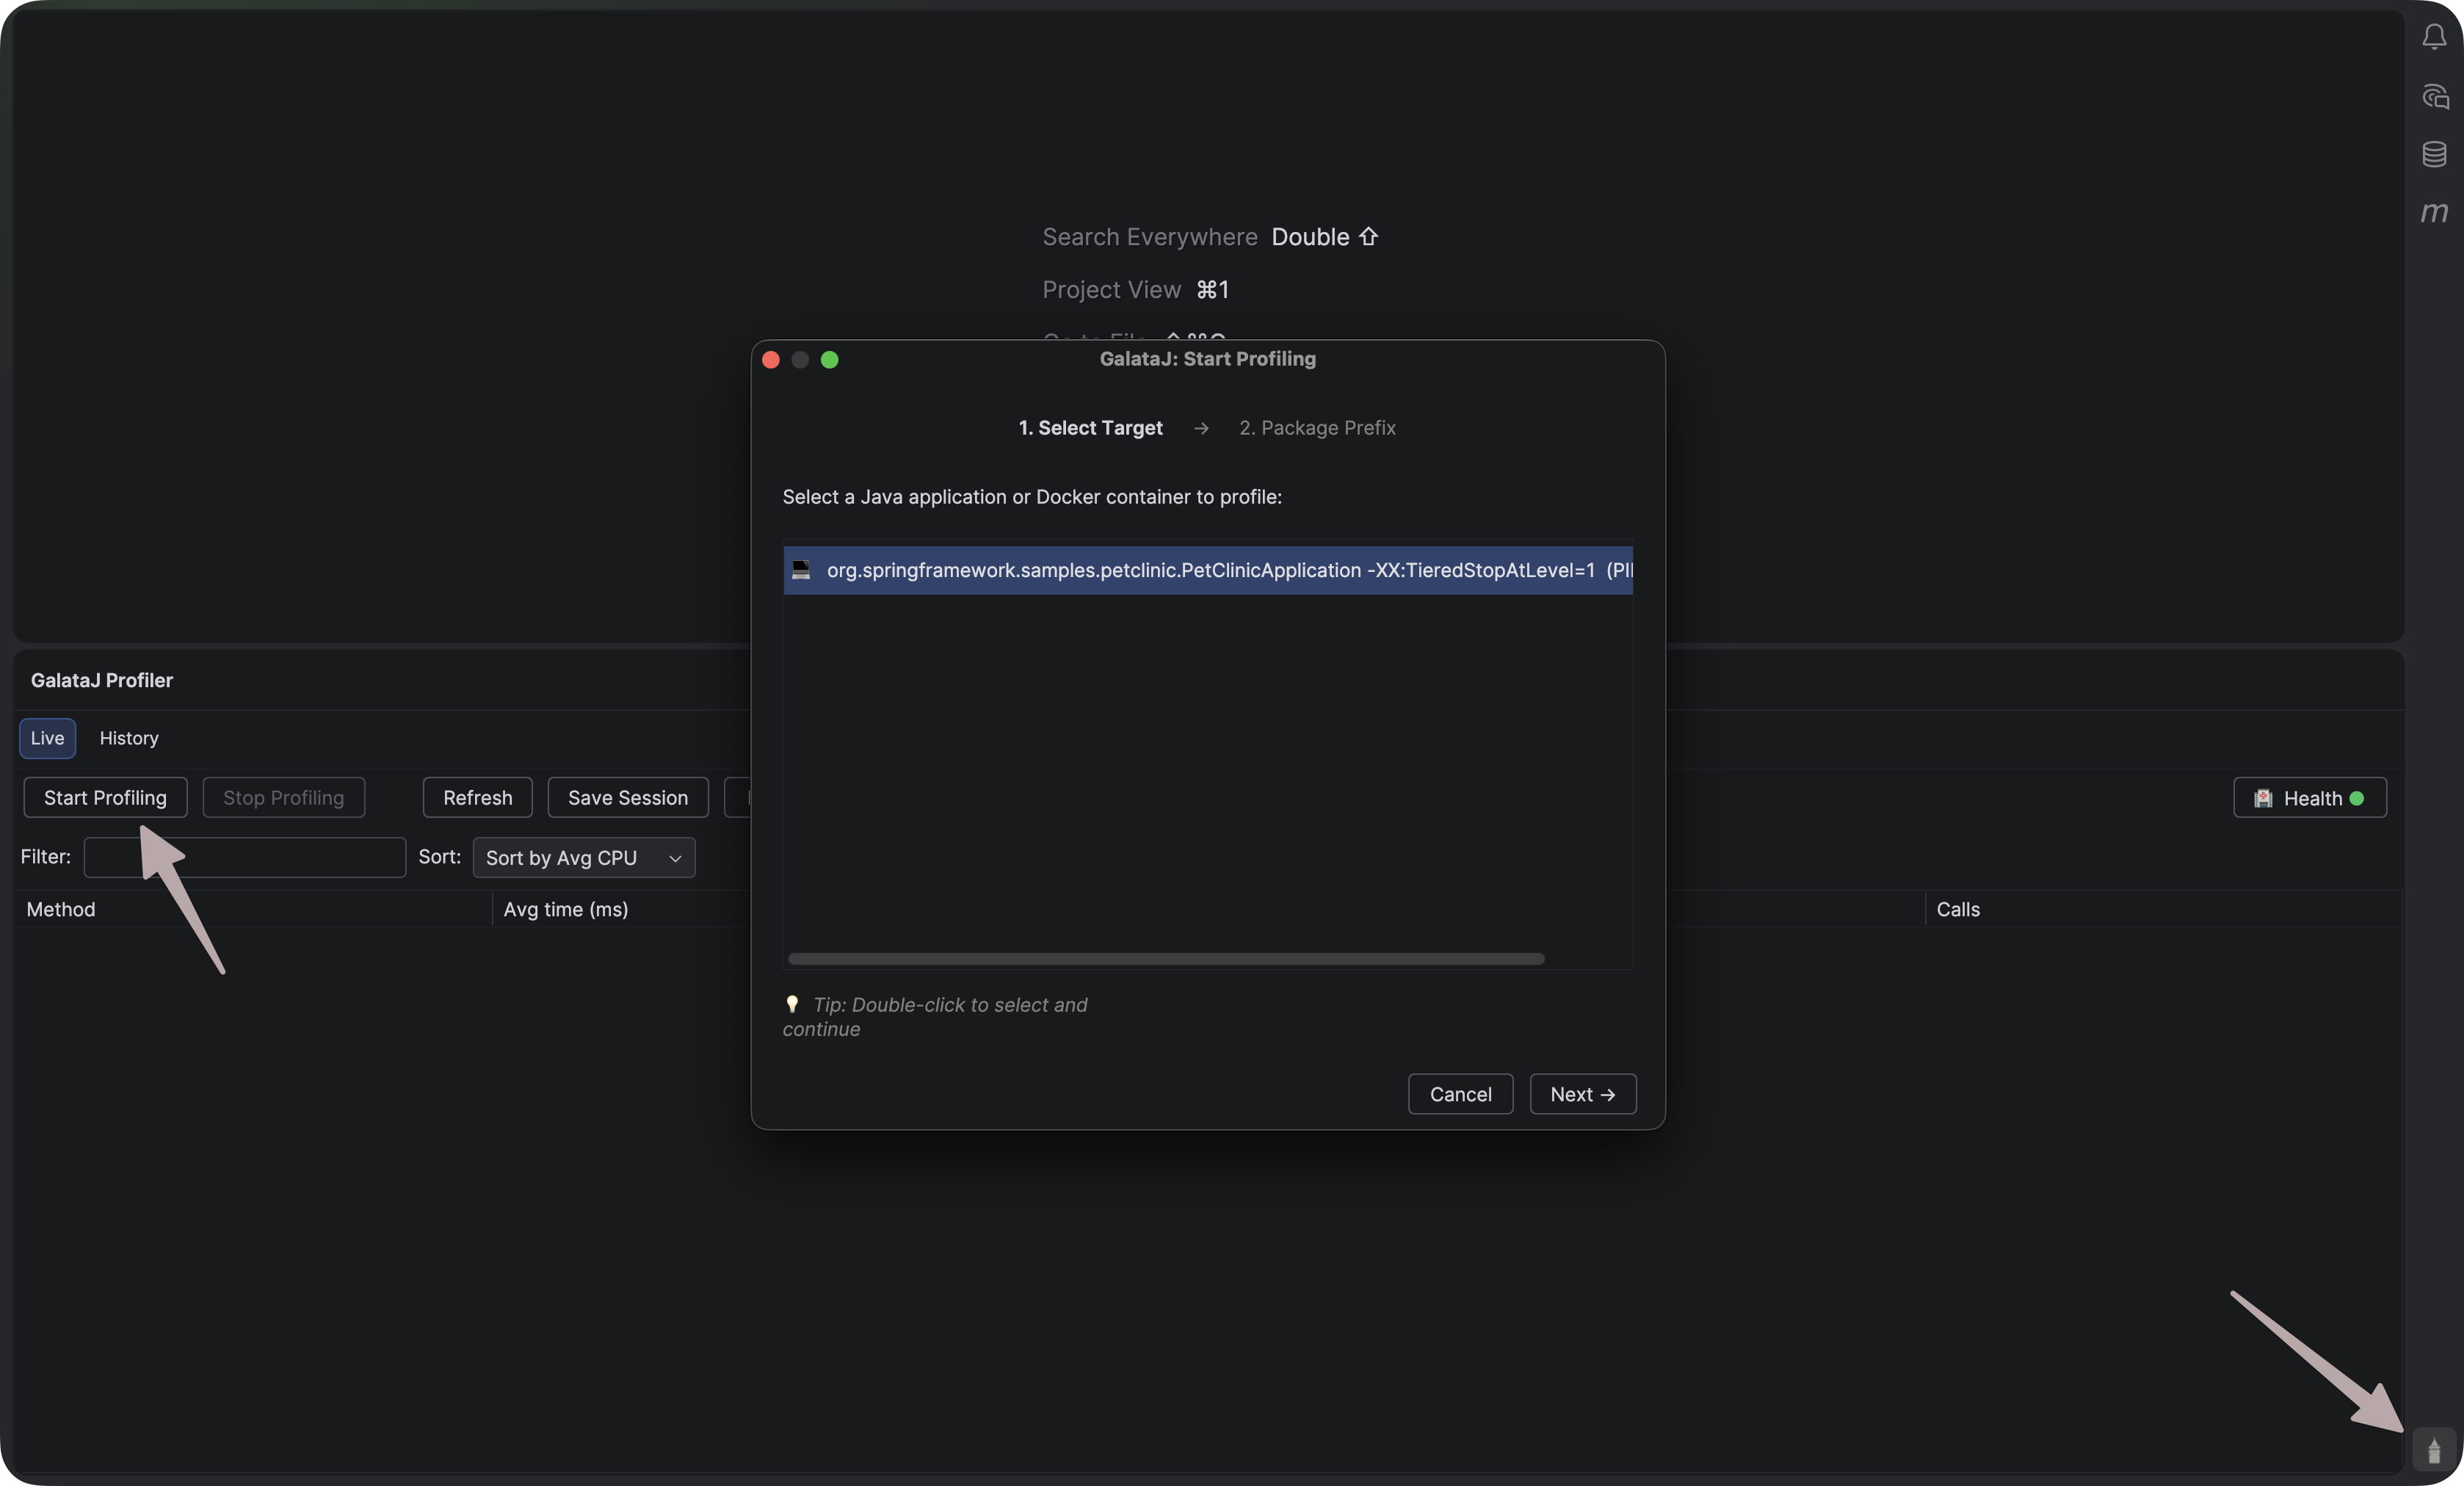
Opening the Panel
Заголовок раздела «Opening the Panel»IntelliJ IDEA / VS Code / Cursor / Windsurf
Заголовок раздела «IntelliJ IDEA / VS Code / Cursor / Windsurf»Click the GalataJ icon at the right bottom of your IDE.
Panel Layout
Заголовок раздела «Panel Layout»Toolbar
Заголовок раздела «Toolbar»The top bar contains:
- Start/Stop — Toggle profiling
- JVM Selector — Choose which Java process to profile
- Refresh — Update the JVM list
- Health — Check system status
Methods List
Заголовок раздела «Methods List»The main area shows all profiled methods with columns:
| Column | What it shows |
|---|---|
| Method | Class and method name |
| Avg | Average execution time |
| Max | Maximum execution time |
| Calls | Number of invocations |
| Trend | Performance change |
Status Bar
Заголовок раздела «Status Bar»The bottom shows:
- Profiling status (Active/Stopped)
- Connected JVM name
- Last update time
Sorting Methods
Заголовок раздела «Sorting Methods»Click any column header to sort:
- Avg — Find your slowest methods
- Calls — Find your most-called methods (N+1 query detection!)
- Trend — Find methods that are getting slower
Click again to reverse the sort order.
Navigating to Code
Заголовок раздела «Navigating to Code»Double-click any method to jump directly to its source code.
The IDE opens the file and positions your cursor at the method.
Keep it Visible
Dock the panel next to your editor for constant visibility
Sort by Avg First
Start with slowest methods — they have the most optimization potential
Watch for High Calls
High call count + low time often means N+1 queries
Check Trends
Rising trends (↑) mean something changed — investigate!
Next Steps
Заголовок раздела «Next Steps»- Understanding Metrics — Learn what the numbers mean
- Session History — Save and compare sessions